Pair#
Basic examples of pairs, trying to extract fires. Here the reference product will be the pre-event image, the secondary being the post-event.
Initialization of the notebook#
Imports
Loggers
Paths
from cloudpathlib import AnyPath
from eosets.pair import Pair
from eoreader.bands import NBR
from matplotlib import pyplot as plt
import cartopy.crs as ccrs
# Create logger
import logging
from sertit import logs

logs.init_logger(logging.getLogger("eoreader"), log_lvl=logging.INFO)
logs.init_logger(logging.getLogger("eosets"))
# Get the base paths
data_path = AnyPath(r"/home/ds2_db3/CI/eosets/DATA")
# Get a dictionary of Sentinel-2, Sentinel-3 and Landsat-8 reference and secondary images
s2_paths = {
    "reference_paths": [data_path / "S2A_MSIL1C_20200824T110631_N0209_R137_T29TQE_20200824T150432.zip"],
    "secondary_paths": [data_path / "S2B_MSIL1C_20200908T110619_N0209_R137_T29TQE_20200908T132324.zip"],
}

s3_paths = {
    "reference_paths": [data_path / "S3B_SL_1_RBT____20200824T105515_20200824T105815_20200825T151744_0179_042_322_2340_LN2_O_NT_004.SEN3"],
    "secondary_paths": [data_path / "S3B_SL_1_RBT____20200909T104016_20200909T104316_20200910T161910_0179_043_165_2340_LN2_O_NT_004.SEN3"],
}

l8_paths = {
    "reference_paths": [data_path / "LC08_L1TP_202032_20200828_20200906_02_T1.tar"],
    "secondary_paths": [data_path / "LC08_L1TP_202032_20200929_20201006_02_T1.tar"],
}

all_paths = [s2_paths, s3_paths, l8_paths]

aoi_path = data_path / "Fire_Spain.geojson"
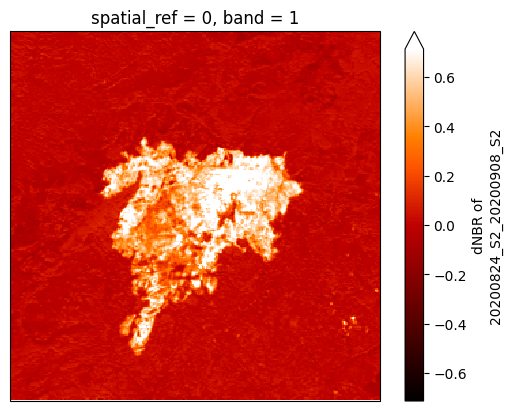
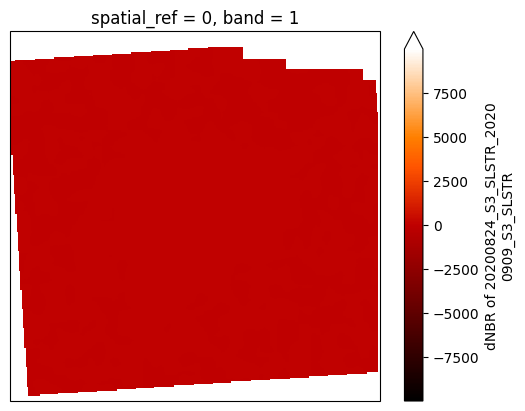
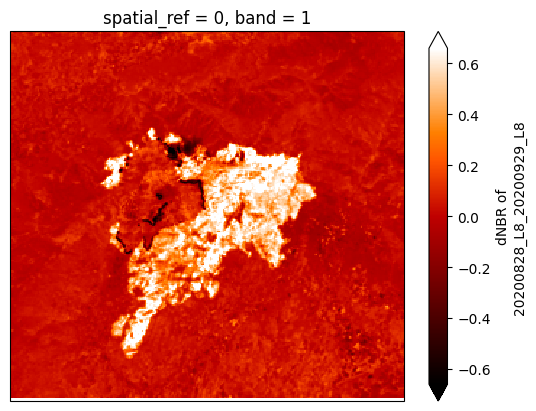
Creation of the Pairs and loading of dNBR#
To create a pair, you just have to give the paths of your products. The reference and secondary products should overlap.
The goal here will be to extract the dNBR band of the pair and display it for every pair.
\[
dNBR = NBR_{pre} - NBR_{post}\]
\[
NBR = \frac{NIR - SWIR}{NIR + SWIR}
\]
for paths in all_paths:
    # Create pair with reference and secondary paths
    pair = Pair(**paths)

    # Load dNBR
    _, _, dnbr_ds = pair.load(
        diff_bands=NBR,
        window=aoi_path,
        pixel_size=60
    )
    dnbr = dnbr_ds[NBR]
    dnbr.attrs["long_name"] = f"dNBR of {pair.condensed_name}"

    # Plot the pairs
    crs = ccrs.UTM(str(dnbr.rio.crs.to_epsg())[-2:])
    dnbr.plot(
        robust=True,
        transform=crs,
        x="x",
        y="y",
        cmap="gist_heat",
        subplot_kws={'projection':crs}
    )
    plt.show()
2026-01-06 16:43:03,722 - [DEBUG] - *** Loading ['NBR'] for 20200824T110631_S2_T29TQE_L1C_150432 ***
/opt/conda/lib/python3.11/site-packages/rasterio/warp.py:387: NotGeoreferencedWarning: Dataset has no geotransform, gcps, or rpcs. The identity matrix will be returned.
  dest = _reproject(
2026-01-06 16:43:08,628 - [DEBUG] - Collocating bands
2026-01-06 16:43:08,632 - [DEBUG] - *** Loading ['NBR'] for 20200908T110619_S2_T29TQE_L1C_132324 ***
2026-01-06 16:43:12,531 - [DEBUG] - Collocating bands
2026-01-06 16:43:14,889 - [DEBUG] - *** Loading ['NBR'] for 20200824T105515_S3_SLSTR_RBT ***
2026-01-06 16:43:59,281 - [DEBUG] - Collocating bands
2026-01-06 16:43:59,284 - [DEBUG] - *** Loading ['NBR'] for 20200909T104016_S3_SLSTR_RBT ***
2026-01-06 16:45:17,318 - [DEBUG] - Collocating bands
'_vectorize' function is not lazy yet. Computing the raster.
'_vectorize' function is not lazy yet. Computing the raster.
2026-01-06 16:45:26,786 - [DEBUG] - *** Loading ['NBR'] for 20200828T110153_L8_202032_OLI_TIRS ***
2026-01-06 16:45:29,287 - [DEBUG] - Collocating bands
2026-01-06 16:45:29,289 - [DEBUG] - *** Loading ['NBR'] for 20200929T110204_L8_202032_OLI_TIRS ***
2026-01-06 16:45:31,708 - [DEBUG] - Collocating bands
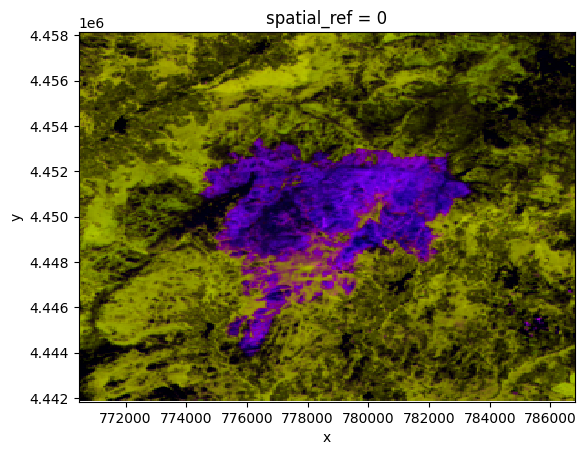
Stacking pairs#
A pair can also be stacked.
pair = Pair(**s2_paths)
stack = pair.stack(
    reference_bands=NBR,
    secondary_bands=NBR,
    diff_bands=NBR,
    window=aoi_path,
    pixel_size=60
    )
stack
2026-01-06 16:45:44,344 - [DEBUG] - *** Loading ['NBR'] for 20200824T110631_S2_T29TQE_L1C_150432 ***
2026-01-06 16:45:47,470 - [DEBUG] - Collocating bands
2026-01-06 16:45:47,473 - [DEBUG] - *** Loading ['NBR'] for 20200908T110619_S2_T29TQE_L1C_132324 ***
2026-01-06 16:45:50,148 - [DEBUG] - Collocating bands
<xarray.DataArray 'Reference_NBR_Secondary_NBR_dNBR' (bands: 3, y: 272, x: 272)> Size: 888kB
dask.array<where, shape=(3, 272, 272), dtype=float32, chunksize=(1, 272, 272), chunktype=numpy.ndarray>
Coordinates:
  * x            (x) float64 2kB 7.705e+05 7.706e+05 ... 7.867e+05 7.868e+05
  * y            (y) float64 2kB 4.458e+06 4.458e+06 ... 4.442e+06 4.442e+06
    spatial_ref  int64 8B 0
  * bands        (bands) object 24B MultiIndex
  * variable     (bands) <U13 156B 'Reference_NBR' 'Secondary_NBR' 'dNBR'
  * band         (bands) int64 24B 1 1 1
Attributes:
    long_name:       Reference_NBR Secondary_NBR dNBR
condensed_name: 20200824_S2_20200908_S2stack.plot.imshow(vmin=0, vmax=1, robust=True)
<matplotlib.image.AxesImage at 0x7f7b04376190>