Series#
Basic examples of series, displaying NBR of all images.
Initialization of the notebook#
Imports
Loggers
Paths
from cloudpathlib import AnyPath
from eosets.series import Series
from eoreader.bands import NBR
from matplotlib import pyplot as plt
import cartopy.crs as ccrs
# Create logger
import logging
from sertit import logs

logs.init_logger(logging.getLogger("eoreader"), log_lvl=logging.INFO)
logs.init_logger(logging.getLogger("eosets"))
# Get the base paths
data_path = AnyPath(r"/home/ds2_db3/CI/eosets/DATA")
# Get a list of list (for potential mosaics) of Sentinel-2 images
s2_paths = [
    [data_path / "S2A_MSIL1C_20200824T110631_N0209_R137_T29TQE_20200824T150432.zip"],
    [data_path / "S2B_MSIL1C_20200908T110619_N0209_R137_T29TQE_20200908T132324.zip"]
]
aoi_path = data_path / "Fire_Spain.geojson"
Creation of the Series and loading of NBR#
To create a series, you just have to give the paths of your products.
The goal here will be to extract the NBR band for each product composing the series and display the most recent one.
\[
NBR = \frac{NIR - SWIR}{NIR + SWIR}
\]
series = Series(paths=s2_paths)
# Load NBR
nbr_ds = series.load(
bands=NBR,
window=aoi_path,
pixel_size=60
)
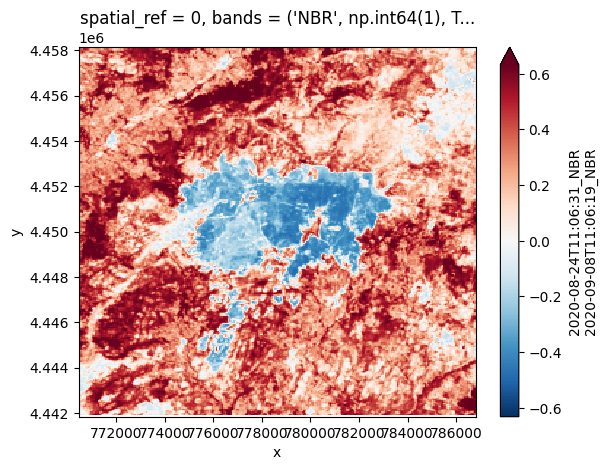
# Plot the pairs
crs = ccrs.UTM(str(nbr_ds.rio.crs.to_epsg())[-2:])
nbr_ds["NBR"].isel(time=-1).plot(
robust=True,
transform=crs,
x="x",
y="y",
cmap="gist_heat",
subplot_kws={'projection':crs}
)
plt.show()
2026-01-06 16:46:08,081 - [DEBUG] - *** Loading ['NBR'] for 20200824T110631_S2_T29TQE_L1C_150432 ***
/opt/conda/lib/python3.11/site-packages/rasterio/warp.py:387: NotGeoreferencedWarning: Dataset has no geotransform, gcps, or rpcs. The identity matrix will be returned.
  dest = _reproject(
2026-01-06 16:46:10,942 - [DEBUG] - Collocating bands
2026-01-06 16:46:10,947 - [DEBUG] - *** Loading ['NBR'] for 20200908T110619_S2_T29TQE_L1C_132324 ***
2026-01-06 16:46:13,456 - [DEBUG] - Collocating bands
nbr_ds
<xarray.Dataset> Size: 596kB
Dimensions:      (x: 272, y: 272, band: 1, time: 2)
Coordinates:
  * x            (x) float64 2kB 7.705e+05 7.706e+05 ... 7.867e+05 7.868e+05
  * y            (y) float64 2kB 4.458e+06 4.458e+06 ... 4.442e+06 4.442e+06
  * band         (band) int64 8B 1
  * time         (time) datetime64[ns] 16B 2020-08-24T11:06:31 2020-09-08T11:...
    spatial_ref  int64 8B 0
Data variables:
    NBR          (band, y, x, time) float32 592kB 0.2922 0.2713 ... nan nan
Attributes:
    long_name:       NBR
condensed_name: 20200824_S2_20200908_S2Stacking Series#
A series can also be stacked.
stack = series.stack(NBR,
    window=aoi_path,
    pixel_size=60
    )
stack
2026-01-06 16:46:13,756 - [DEBUG] - Collocating bands
2026-01-06 16:46:13,775 - [DEBUG] - Collocating bands
<xarray.DataArray '2020-08-24T11:06:31_NBR_2020-09-08T11:06:19_NBR' (bands: 2,
                                                                     y: 272,
                                                                     x: 272)> Size: 592kB
array([[[ 0.2921541 ,  0.4139978 ,  0.41991296, ...,  0.08650824,
          0.03820093,  0.00584048],
        [ 0.27876884,  0.4225966 ,  0.38983887, ...,  0.08060092,
          0.03870746, -0.00358632],
        [ 0.36654684,  0.43029016,  0.49133572, ...,  0.08450998,
          0.04147995,  0.09818488],
        ...,
        [ 0.01637264, -0.02052821, -0.04768683, ...,  0.53870374,
          0.5130346 ,  0.3918294 ],
        [-0.08017797, -0.09235279, -0.02769805, ...,  0.56385565,
          0.5784638 ,  0.45262298],
        [        nan,         nan,         nan, ...,         nan,
                 nan,         nan]],

       [[ 0.2713167 ,  0.36375195,  0.4012808 , ...,  0.06398248,
          0.00872208, -0.03413457],
        [ 0.25719634,  0.40440372,  0.35089213, ...,  0.04503268,
         -0.01421591, -0.05832091],
        [ 0.33739296,  0.41638872,  0.4395191 , ...,  0.04619306,
         -0.00714318,  0.01256679],
        ...,
        [ 0.00623939, -0.02166266, -0.05898938, ...,  0.50768423,
          0.47528344,  0.41964224],
        [-0.09203331, -0.11481584, -0.05865944, ...,  0.5894746 ,
          0.5899844 ,  0.4242628 ],
        [        nan,         nan,         nan, ...,         nan,
                 nan,         nan]]], shape=(2, 272, 272), dtype=float32)
Coordinates:
  * x            (x) float64 2kB 7.705e+05 7.706e+05 ... 7.867e+05 7.868e+05
  * y            (y) float64 2kB 4.458e+06 4.458e+06 ... 4.442e+06 4.442e+06
    spatial_ref  int64 8B 0
  * bands        (bands) object 16B MultiIndex
  * variable     (bands) <U3 24B 'NBR' 'NBR'
  * band         (bands) int64 16B 1 1
  * time         (bands) datetime64[ns] 16B 2020-08-24T11:06:31 2020-09-08T11...
Attributes:
    long_name:       2020-08-24T11:06:31_NBR 2020-09-08T11:06:19_NBR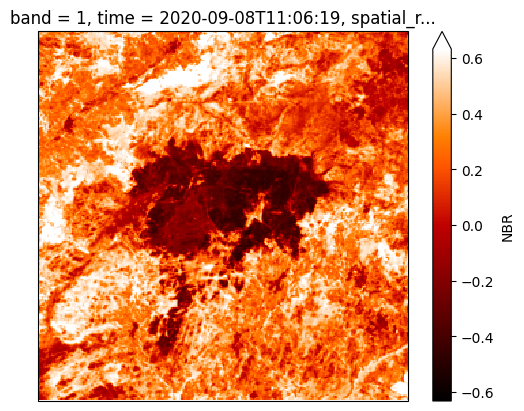
condensed_name: 20200824_S2_20200908_S2stack.isel(bands=1).plot(robust=True)
<matplotlib.collections.QuadMesh at 0x7fc6f066f210>